CO₂ Analysis Module
MIA Mobility Engine
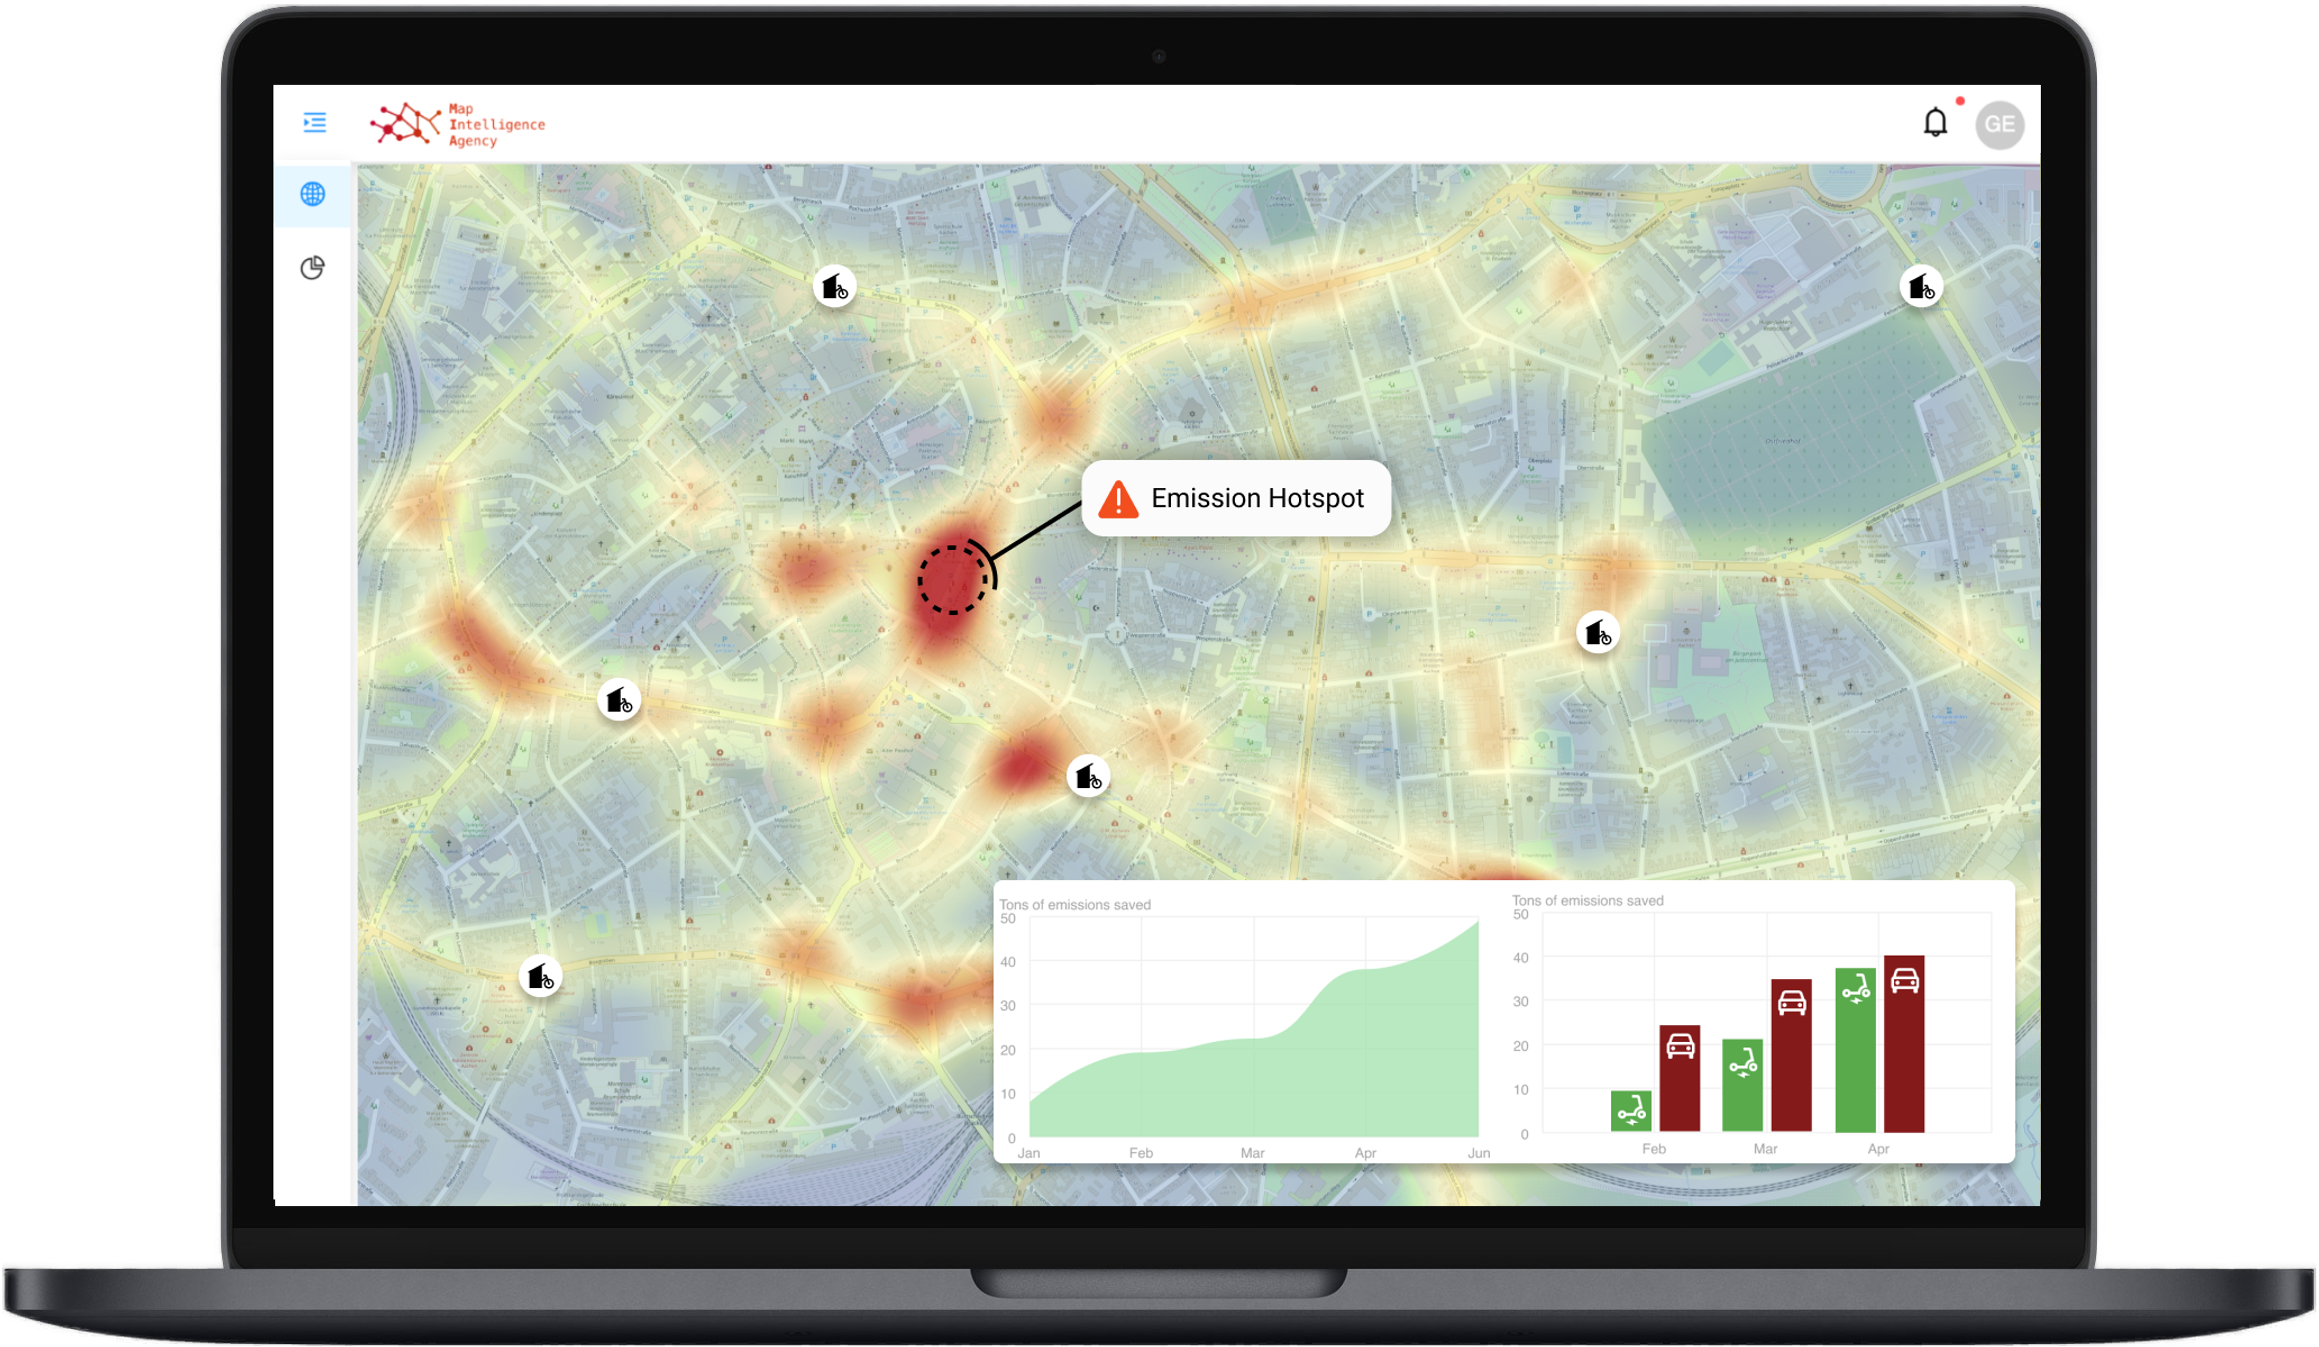
The CO₂ dashboard of the MIA Mobility Engine makes it possible to track the CO₂ balance of a fleet. For this purpose, the balance can be tracked as a graph and it is also immediately apparent on a map where action and optimization potentials lie.
Easily achieve targets and regulatory requirements and communicate to stakeholders. Various data analyses in the CO₂ dashboard provide a wide range of data and key figures in a historical framework, which are an important part of public relations and internal reporting.
If your fleet is station-based, or vehicles are available at fixed locations, CO₂ consumption and CO₂ savings can also be displayed per location and vehicle.
Powerful filtering options allow you to easily compare different time ranges. With this decisions can be made better and also verified.
CO₂ analysis uses fleet trip data to measure and visualize the environmental footprint. In consultation with customers, we adapt the algorithms so that all stages of the fleet, including deployment and maintenance, are included in the calculations.
- Visualization of environmental balance on an interactive map
- Calculation of various key figures in relation to CO₂ consumption, use per vehicle, overall balance, ...
- Calculation and detailed overview per location where vehicles are stationed
- Live visualization of vehicles, routes and freight with appropriate data
- Calculation of break-even point of a fleet for CO₂-neutrality
- Extensive filtering options to narrow down metrics, graphs and map